How Have Social Media Experiences Changed from March-September 2023
Platform usage and experiences were generally stable with directional trends that mirror other sources, but that generally fell within our margin of error.
Between corporate takeovers, massive layoffs and restructuring, and the passage of extensive regulatory policies, 2023 is notable for the seismic events shaking the technology sector’s tectonic plates. Corporate takeovers may lead to dramatic changes in company mission statements, values, and how their app functions (or whether their app functions at all). Layoffs that disproportionately affected employees working on making digital spaces safer for the users occupying them could well lead to increased risks to users, like those seen in the uptick in hate speech on X (Twitter) and disinformation campaigns by Russia in Ukraine on Facebook and Instagram. The passage of landmark regulatory policy, like the Digital Services Act, requires companies to take responsibility for harmful content on their platforms and to be more transparent with the public about it. With all of this structural and regulatory change, users’ experiences could reasonably be predicted to be changing.
Thanks to USC Marshall’s Neely Center for Ethical Leadership and Decision Making, the Psychology of Technology Institute, and the John S. and James L. Knight Foundation we are able to examine how US adults’ experiences with the largest social media and communication services are changing over time. In today’s report, I compare usage of and experiences on these platforms and services from our initial survey in March-May 2023 to our latest survey in August-September 2023.
Usage of Online Services
In terms of the percentage of US adults using each app in the past 28 days, most apps did not see significant climbs or falls in their overall popularity. X (Twitter) which fell from the 9th most popular service to the 12th most popular service among US adults. The five most popular apps or services continue to be Email, Text Messaging, YouTube, Facebook, and Instagram. Threads, a new short message broadcasting app within Instagram, launched between the first two waves of the survey, but was added in the latest wave. 4.2% of US adults reported using Threads in the past 28 days, but given that is the first time asking about that platform, it is not possible to calculate the percent change since the initial survey wave and is excluded from this analysis.
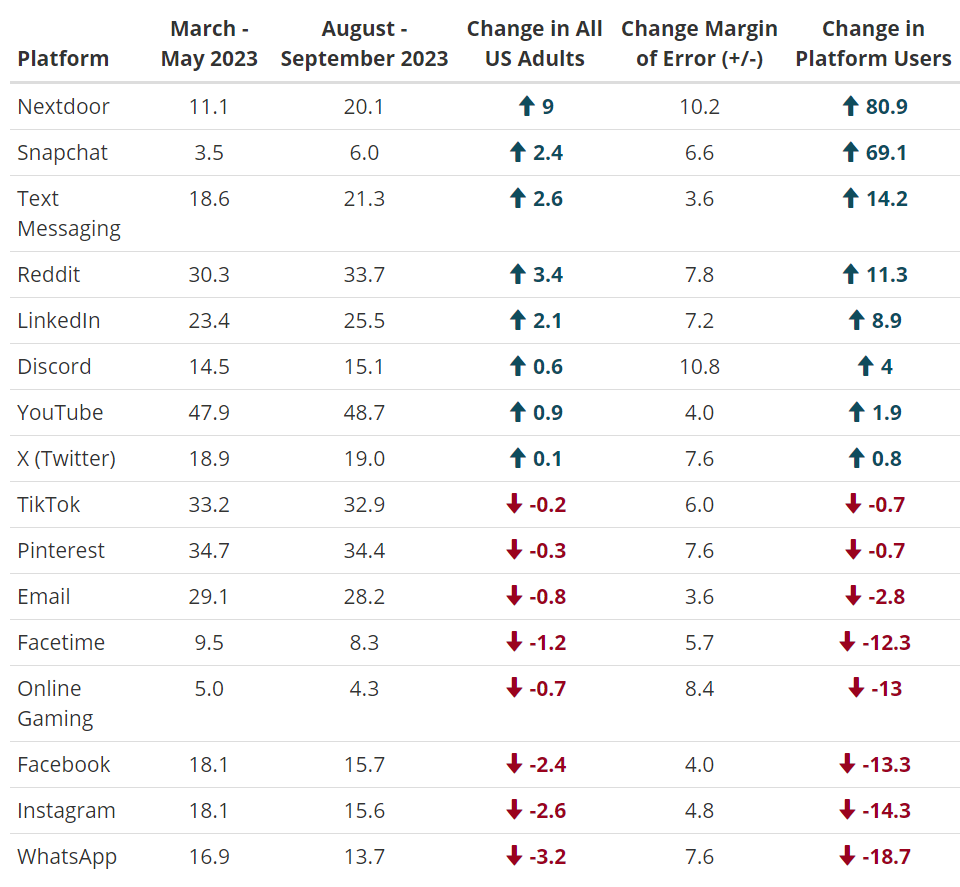
In the table below, I show the percentage of US adults using each platform within the previous 28 days in our March - May 2023 survey and our August - September 2023 survey, the difference between those two time points, and the percentage difference between the two time points relative to the percentage of people using the platform in March - May 2023. The margin of error is 3.3%, and no platform showed a change greater than that between these two survey waves. That said, margin of error is related to sample size, which limits our ability to detect statistically significant small shifts in a relatively short period of time, like the 6 months between the two waves of data examined here. Being within the margin of error means that there is a greater than 5% chance that trends are statistical noise. In future waves, we plan on increasing our sample size to increase our confidence in observed changes.
While within the margin of error, numerical differences may suggest directional shifts for usage of different platforms that are consistent with other sources. X (Twitter) saw 14% of its US adult users stop using its app in the previous 28 days relative to 6 months ago. This decrease in the number of Twitter users is identical to that found by the analytics firm SimilarWeb’s independent survey and is consistent with CEO Linda Yaccarino’s remarks at the Code Conference where she noted that their daily active users had declined. NextDoor also exhibited a decrease of 11% of users in that same time period.
On the other end of the spectrum, WhatsApp showed the largest gain in monthly active users among US adults. This growth is not surprising given Meta’s recent statements that WhatsApp’s fastest growing user segments are in North America. Instagram, Snapchat, Reddit, and Text Messaging saw smaller increases in monthly active US adult users. All other apps maintained their share of US adult monthly active users.
While correlational data cannot confirm the causal factors pushing users away from or pulling users towards platforms, they can hint at possible causal forces to be examined in subsequent experimental research. Next, I report changes in user experiences assessed by 4 main top-level questions that respondents who use each platform were asked in the two survey waves:
In the past [28 days/4 weeks], have you experienced a meaningful connection with others on [services used]? (examples could include exchanging emotional support or bonding over shared experiences)
In the past [28 days/4 weeks], have you learned something that was useful or that helped you understand something important on [services used]?
In the past [28 days/4 weeks], have you personally witnessed or experienced something that affected you negatively on [service used]?
In the past [28 days/4 weeks], have you witnessed or experienced content that you would consider bad for the world on [services used]? (examples could include content that is misleading, hateful, or unnecessarily divisive)?
Meaningful Connections with Others
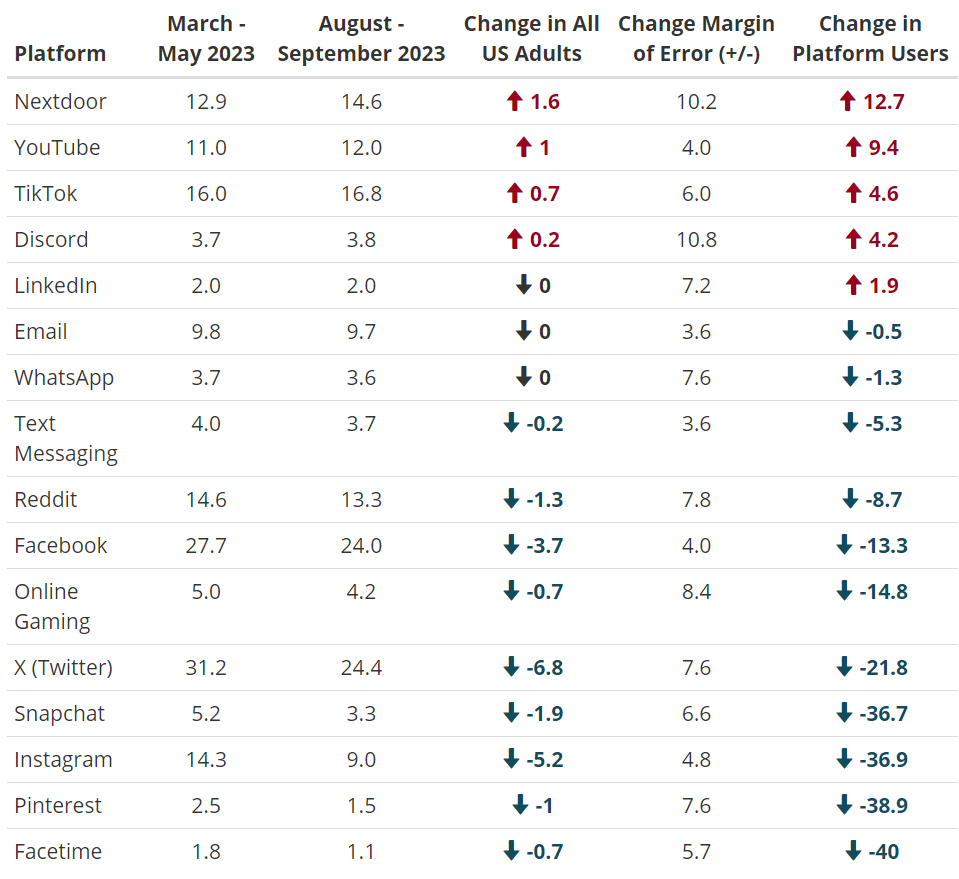
First, we look at one of two positive user experiences people may have on social media and communication services that we included in our survey -- whether or not they experienced a meaningful connection with others on the service within the past 28 days. Facetime was the only service where there was a significant increase in the percent of US adults reporting making a meaningful connection with others on the app in the last month. LinkedIn and Discord also showed numerical increases in reporting meaningful connections with others in the past 28 days.
Other apps showed larger numerical changes, but have smaller user bases, meaning the margin of error is larger which reduces our confidence in the specific change. These apps with smaller user bases, large numerical decreases in meaningful connections with others, and larger margins of error are Nextdoor, Pinterest, TikTok, and X (Twitter).
Learning Something Useful or Important
Next, we look at the other positive experiences users may have on these social media and communication services -- whether they learned something useful or important. Again, no service showed a significant increase or decrease in this short time window with our sample size.
Every service owned by Meta Platforms, Inc. -- WhatsApp, Instagram, and Facebook -- showed directional decreases in the percentage of users reporting that they learned something useful or important to them over the past 6 months. This may be the result of the company’s continued push to demote political content and minimize distribution of news content on their platforms. In fact, they’ve even gone so far as to remove the News Tab feature in some countries. Online Gaming and Facetime also showed smaller decreases in the percent of users reporting learning something useful or important.
On the other side of the spectrum, NextDoor and Snapchat each showed large directional increases in the percentage of users reporting learning something useful or important. Text messaging, Reddit, and LinkedIn also showed slight numerical increases in the percent of their users reporting learning something useful or important on those services from March to September 2023.
Negative Experiences that Personally Affected Users
Next, we look at one of the two negative experiences users may have on social media and communication services included in our survey -- whether they personally witnessed or experienced something that affected them negatively. No service showed a significant change over this short time frame given our sample size.
Numerically, most services showed decreases in reported negative experiences from March to September 2023. Pinterest, Snapchat, and Facetime, all services with very low rates of negative personal experiences at baseline, showed the largest percent decreases over the past 6 months. Instagram, Reddit, Online Gaming, Nextdoor, YouTube, and text messaging also showed reduced negative personal experiences.
On the other end of the spectrum, LinkedIn, WhatsApp, and TikTok all showed directional increases in these negative experiences from March to September 2023. The potential increase of negative personal experiences on LinkedIn may be related to the normalization of “oversharing” personal news, like divorces and experiences urinating in public, which apparently is becoming more common. Though, there could be many other causes driving this shift, like many layoff posts, though those seem less likely because the number of layoff announcements has held steady for much of 2023 (including both time periods when this survey was fielded).
Experiences that are Bad for the World
Next, we look at the second of our two negative experiences users may have on social media and communication services -- whether they witnessed or experienced content that they would consider bad for the world. Instagram was the sole app showing a statistically significant decrease in the proportion of users indicating that they had encountered content that they thought was bad for the world from March to September 2023.
Much like the negative personal experiences described above, many services also showed numerical (but not statistically significant) decreases in the percent of users reporting seeing content that they thought was bad for the world. Platforms with a low percentage of users seeing content they perceived as bad for the world in March-May 2023 -- Facetime, Pinterest, and Snapchat -- showed the largest percentage decrease since that initial survey. Instagram, X (Twitter), Online Gaming, Facebook, Reddit, and text messaging also showed decreases. Three (Instagram, Facebook, and X) of these six services showing reductions in experiences with content that is perceived to be bad for the world are also services that are intentionally decreasing the prominence of news on their platforms, and two (Instagram and Facebook) of these three, also showed decreases in the percentage of users reporting that they learned something useful or important on those platforms. Given past research showing that news content is informative, and that it can also contain misinformation, hate, and other contents that are generally bad for the world, it is not surprising to see concurrent reductions in experiencing learning and content that is bad for the world.
On the other end of the spectrum, Nextdoor and YouTube both showed increases in the percentage of users reporting experiencing content that was bad for the world between March and September 2023. Given that most respondents reporting negative experiences on Nextdoor generally mention crime, this increase might be related to the generally higher crime rates observed in the summertime when we launched the second wave of our survey.
How do these platforms rank based on the rate of their users with each of these experiences?
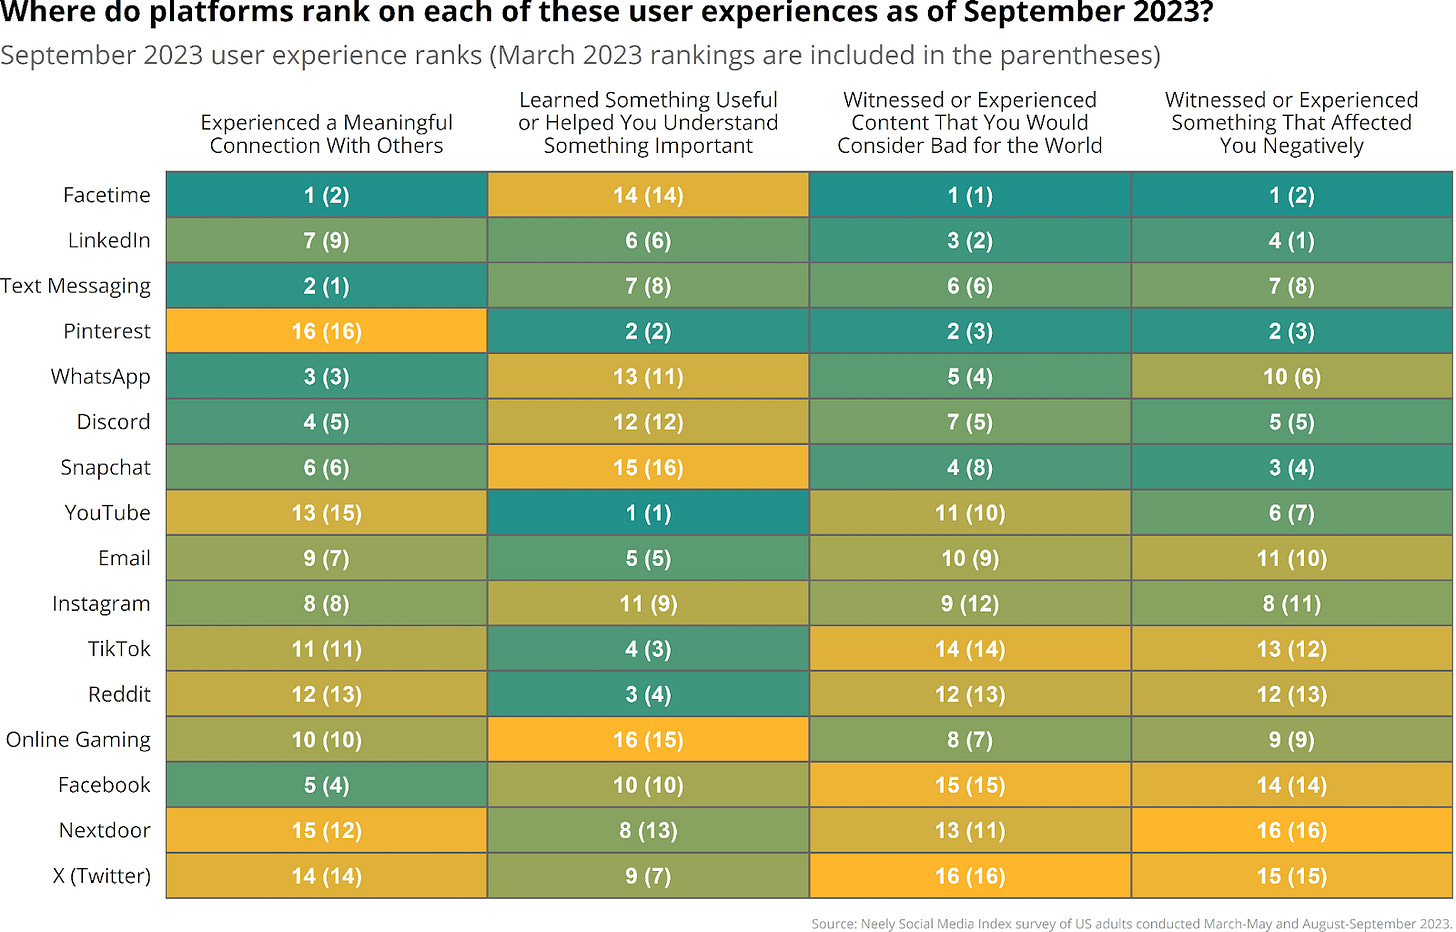
Examining the percent change in experiences on platforms is instructive as it tells us whether user experiences within each of the platforms are improving or worsening over time. The downside of this approach is that it fails to capture the raw frequency of these different experiences between the services. To address this, I created the following heat map that shows the ranking of each service across the four experiences we measured in our survey. To allow for easier comparison of each service’s current ranking to their ranking from 6 months ago, I included their previous rank in parentheses next to their current ranking. I also color-coded each tile so that better scores (i.e., more positive experiences and fewer negative experiences) are shaded in green and worse scores (i.e., fewer positive experiences and more negative experiences) are shaded in yellow.
There are three main take-home points from these rankings:
Traditional social media platforms (e.g., X/Twitter, Facebook, Reddit, TikTok) tend to have more bad experiences than the more direct communication services (e.g., Facetime, text messaging) and the more focused / niche social media platforms (e.g., LinkedIn, Pinterest).
These services are relatively stable in their rankings over the two time points relative to each other. Even when one platform is improving in a user experience over time, they tend not to improve sufficiently to overtake the platforms above them in the rankings. The main exceptions to this are NextDoor and Instagram, which both jumped several spots on multiple user experience dimensions.
The platform that showed the most improvement in terms of percent change over time was X (Twitter). However, despite the relative improvement, user experiences on X (Twitter) were so much worse in the March-May 2023 period that they still rank at or near the bottom of all platforms for 3 of the 4 dimensions.
Summary
The Neely Social Media Index survey is reflecting other publicly available data sources in showing that the percentage of US adults using some social media and communication services are decreasing, as seems to be the case with X (Twitter), or increasing, as is the case with Instagram. However, we need a larger sample to feel more confident in our results, which generally fell within the margin of error, so we will be increasing our sample size in subsequent surveys. In addition to corroborating others’ findings at single discrete time points, we are able to monitor how user experiences are changing over time.
In our first report examining change over a 6 month period this year, we broadly find that reported usage and experience is relatively stable, with most all observed changes falling within the margin of error. We do observe a number of directional changes in users’ experiences that sensibly relate to publicly announced product changes. However, we need either greater differences to occur or to increase our sample size to feel more confident in these changes. Recent testimony in Congress about social media has highlighted the importance of measuring user experience and we are hopeful that our results can contribute not only to our understanding of platforms, but our understanding of how to better measure such experience over time.
This is the first report of many and we are especially excited to continue to monitor changes in user experiences as a result of world events that may lead to greater user experience changes, including global conflicts (e.g., in Ukraine and Israel/Gaza) and the 2024 US Presidential Election. Platforms are likely to make varying product decisions in relation to these events, and the current report suggests that our method could give us insight into the effectiveness (or ineffectiveness) of the approaches adopted by these platforms over time. To improve our ability to detect important small shifts with sufficient statistical confidence, we are shifting from monthly to quarterly data collection and increasing the number of respondents in each wave of our survey.


