


Social Media Experiences Across Nearly 2 Years Since Launching the Social Media Index
With new data through January 2025, we find that social media use is decreasing, bad experiences are mostly holding steady, and positive experiences are increasing on some platforms

This is a post where Senior Advisor Matt Motyl analyzes and summarizes data from the University of Southern California Marshall School’s Neely Center Ethics and Technology Indices. The project builds on industry precedent to create independent verifiable, cross-platform metrics of user experiences, which we leverage in discussions with companies, the press, and policy makers. You can read more about the methodology of the project here and find a full list of analyses here.
------------------------------------------------------------
If Judy Garland were to compare social media and communication technology today to that from just 2 years ago, she would say: “Toto, I’ve a feeling we’re not in Silicon Valley anymore.” For many years, the major social platforms made numerous incremental changes, but none of them as revolutionary as those stacking upon one another since 2023.
The term Large Language Model (LLMs) was unfamiliar to all but a subset of computer scientists and engineers. Today, the majority of US adults are aware of LLMs and related generative artificial intelligence tools, and the number using these tools is climbing rapidly. But, these tools are not confined unto themselves. Instead, they have been integrated into most of the social platforms that people, historically, used to socialize with other people. For example, Meta created many accounts that their AI agents took control over and would use the platform as any real human would -- they jumped into conversations, offered advice, and even offered to sell “gently used” consumer products that they didn’t actually have for actual money to real humans on Facebook marketplace.
TikTok continued its ascendance as the first competitor to Facebook in the traditional social media space to eclipse 2 billion users. And then, TikTok became the first social media app to be banned in the United States and removed from app stores, before the outgoing president decided not to enforce it and the incoming president decided to delay enforcing the ban for 75 days. Twitter, which demonstrated annual double-digit growth for years, was bought by Elon Musk, rebranded as X, and stopped growing.
Also, true to what Judy Garland said in our hypothetical quote, a number of these social media companies have been moving or exploring moving from Silicon Valley to cheaper locations. X (Twitter) left San Francisco for Bastrop, Texas. Meta is exploring reincorporating in Texas. More broadly, Big Tech companies slashed their office spaces in San Francisco from 16.1 million square feet to 8.3 million square feet. Beyond slashing their spaces, Big Tech companies including many of the companies owning the communication services evaluated in our survey laid off more than 700,000 employees (see TechCrunch).
With all of these changes afoot, it would make sense that there would be some impact on users’ experiences. Thanks to USC Marshall’s Neely Center for Ethical Leadership and Decision Making, the Psychology of Technology Institute, and the John S. and James L. Knight Foundation we were able to start our longitudinal panel survey of US adults’ experiences on social media in early 2023, just as these changes were in their early stages, and continue surveying these US adults through early 2025 as these changes have matured. This report summarizes the top-level changes in usage of social media and communication technologies, and how user experiences with these tools have been affected in light of the many innovations and structural changes at the owning companies.
Usage of Online Services
Overall usage of social apps and platforms generally declined among US adults. 7 apps or services, including Email, Facebook, YouTube, Facetime, LinkedIn, X (Twitter), and Pinterest, experienced statistically significant decreases in the monthly active users. Nextdoor, Online Gaming, Snapchat, and Discord also showed numerical decreases in their active users, though the decrease was within the margin of error. Reddit was the only social app that showed a significant increase in monthly active users among US adults from March 2023 to January 2025. WhatsApp, Instagram, TikTok, and Text Messaging also showed numerical increases within the margin of error.
Relative to the population of users for each of these apps, X (Twitter) lost more than a quarter of its US adult monthly active users over the past two years, with LinkedIn just behind them shedding 24% of its US adult monthly active users. Both of those platforms showed rather steady declines over each of our survey periods, which suggests that these trends are consistent and are likely to continue. Pinterest also showed a significant decline, but the decline was only observed in the most recent survey wave conducted between October 14, 2024 and January 4, 2025. When a significant jump is observed at just one time point, it’s more difficult to evaluate its likely causes and whether it is indicating a future downward trend
On the other end of the spectrum, Reddit exhibited consistent user growth over these past two years and increased its relative share of US adult users by 39.6%, and is now used by 15.5% of the total US adult population. While we cannot know with any causal certainty why Reddit has bucked the trend, it seems reasonable to think that Reddit’s partnership with Google may play some role. As Google agreed to pay Reddit $60M for the rights to train its AI models on Reddit content. Google also gave Reddit access to Google’s AI models to improve its internal site search tool and other features. This partnership could result in the world’s most widely-used search engine to recommend Reddit to more people, and also in making Reddit’s website easier to navigate and thereby improve the user experience. Regardless of whether these are the driving forces behind Reddit’s recent growth, our findings are consistent with independent analyses of Reddit’s user numbers over time.
The overall rankings of the top 8 most widely used platforms mostly remained the same. The only change was that significantly fewer people report being a monthly active email user, and email is now used about as often as text messaging. Facebook, YouTube, Instagram, Facetime, TikTok, and Snapchat all maintained their relative popularity. WhatsApp showed the biggest climb in the ranked popularity, jumping 3 spots, followed by Reddit jumping 2 spots, and Pinterest holding steady. X (Twitter) dropped 3 spots, followed by LinkedIn, Online Gaming, and Nextdoor, which all dropped 1 spot.
We also asked our survey panel about Mastodon, Threads, and Bluesky, three newer social media platforms that received some popular press coverage. Fewer than 1% of US adults used Mastodon, and we removed that from the list of platforms included in our survey. Threads, despite becoming the most rapidly downloaded app ever, struggled to retain users. In August 2023, we found that 4.6% of US adults had used the app in the previous 28 days, but that number was cut in half and has hovered around 2-3% in each of the survey waves since then. Recently, the number of downloads of Threads has accelerated while downloads of X (Twitter) have continued to decline. External data reveals that Bluesky is showing substantial growth, gaining more than 32 million users since it first opened to the public in February 2024. We found that just 1.4% of US adults report using Bluesky in the past month.
Next, I report changes in user experiences assessed by 4 main top-level questions that respondents who use each platform were asked in the two survey waves:
In the past [28 days/4 weeks], have you personally witnessed or experienced something that affected you negatively on [service used]?
In the past [28 days/4 weeks], have you witnessed or experienced content that you would consider bad for the world on [services used]? (examples could include content that is misleading, hateful, or unnecessarily divisive)?
In the past [28 days/4 weeks], have you experienced a meaningful connection with others on [services used]? (examples could include exchanging emotional support or bonding over shared experiences)
In the past [28 days/4 weeks], have you learned something that was useful or that helped you understand something important on [services used]?
Negative Experiences that Personally Affected Users
First, we look at one of the two negative experiences users may have on social media and communication services included in our survey -- whether they personally witnessed or experienced something that affected them negatively in the 28 days prior to completing the survey. Nextdoor was the sole platform showing a statistically significant decrease in the rate of monthly active users reporting a negative personal experience on the platform. TikTok exhibited a marginally significant decrease in the rate of personal negative experiences. Reddit and Online Gaming also showed numerical decreases in these rates, but the decreases were within the margin of error.
On the other end of the spectrum, Discord, LinkedIn, and Instagram showed numerical increases in the rate of negative personal experiences. Again, these increases were within the margin of error. All other platforms and services essentially stayed flat.
The overall rankings of these platforms on the basis of users having negative personal experiences on them shuffled somewhat over the past two years. Nextdoor, which held the top spot in March 2023 but showed significant improvement, dropped to the 3rd highest rate of negative experiences. X (Twitter) and Facebook moved into the top two spots where users report the highest rates of bad personal experiences. At the other extreme, Pinterest obtained the lowest rate of these negative experiences in between August and October of 2023 and has maintained that ranking ever since.

Experiences that are Bad for the World
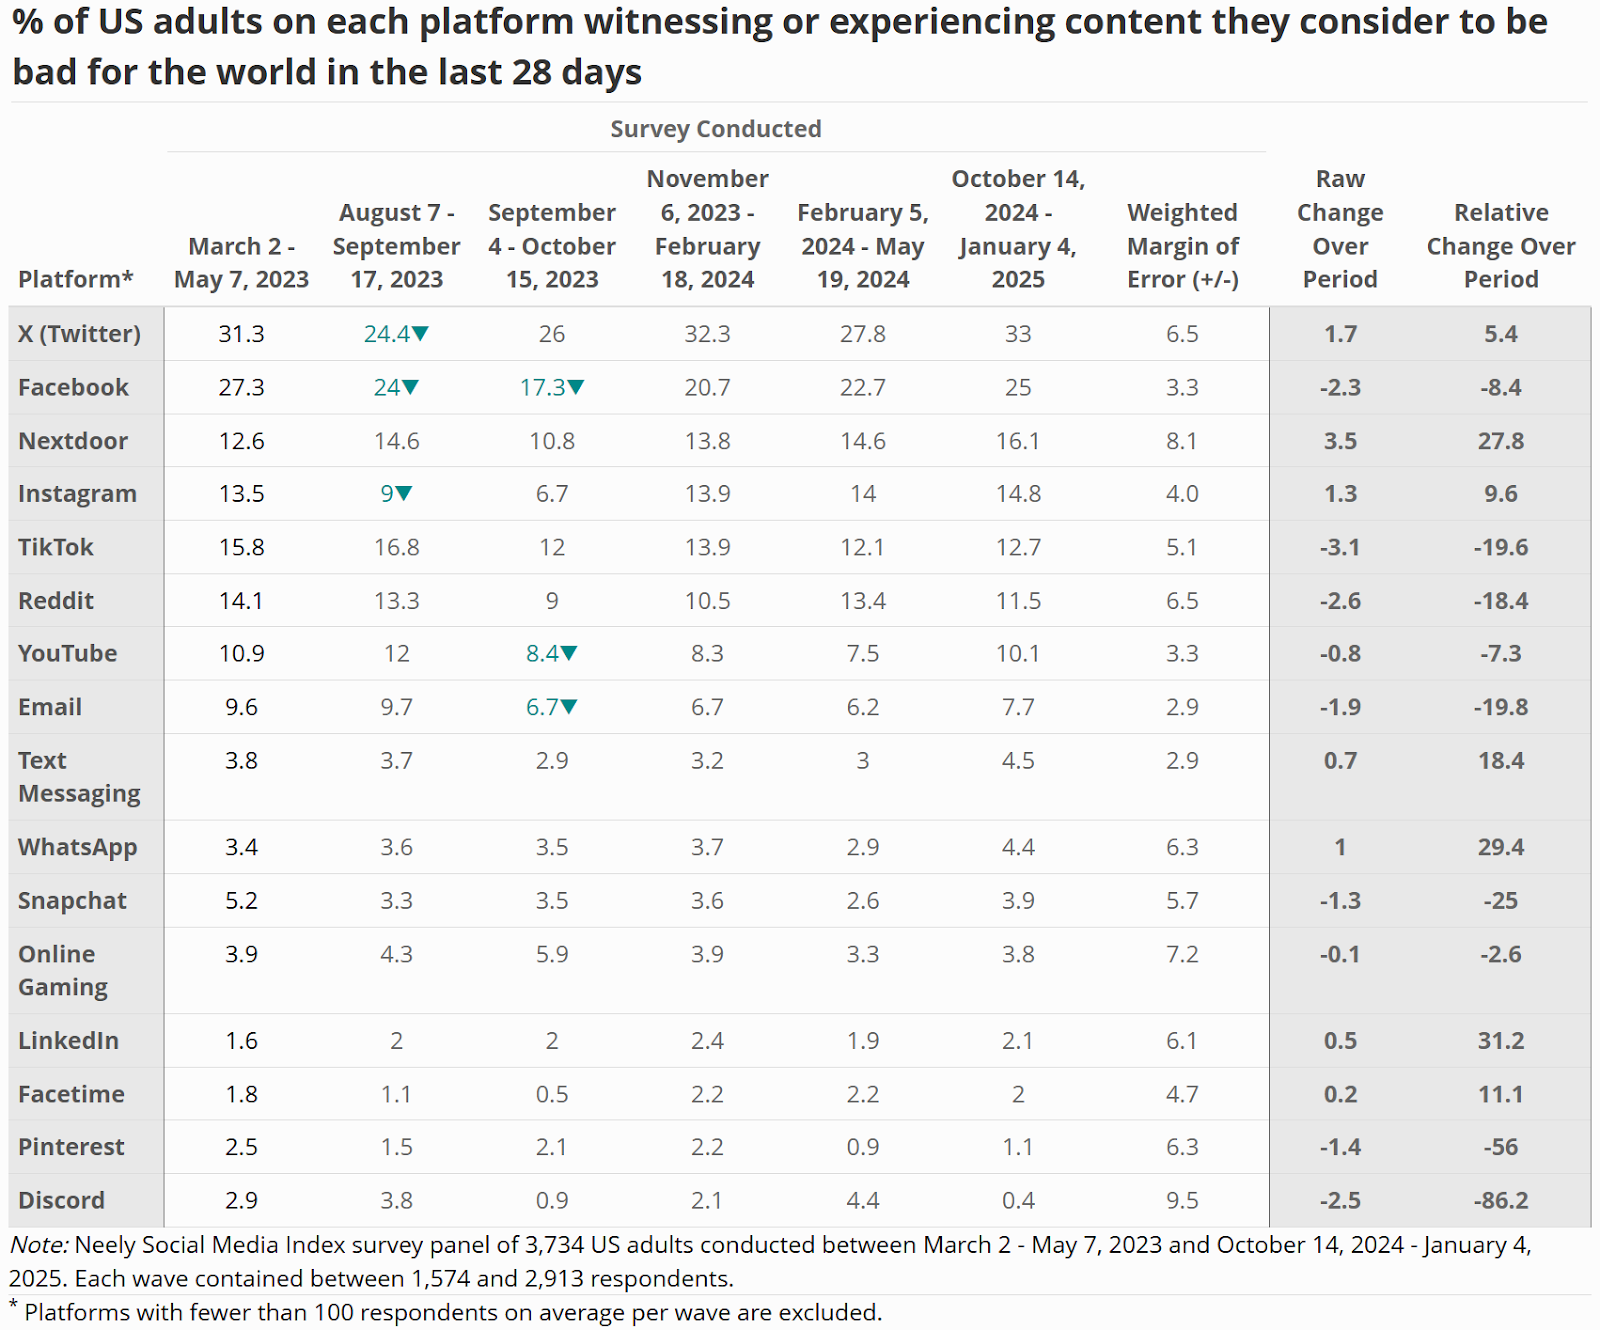
Next, we look at the second of our two negative experiences users may have on social media and communication services -- whether they witnessed or experienced content that they would consider bad for the world. As the table below shows, X (Twitter) remained at the top of the list with the highest rate (33%) of users reporting experiences that they consider bad for the world of any platform in our survey. X (Twitter) did show a marginal increase in the rate of users experiencing content that is bad for the world over the past two years, but this increase was within the margin of error. Facebook maintained the second highest rate (25%) of users experiencing content that was bad for the world, but did show a non-significant decrease in this rate over the full time period. Discord and Pinterest exhibited the lowest rates of these bad experiences, with Facetime, LinkedIn, Online Gaming, Snapchat, and WhatsApp showing slightly numerically greater rates.
While no platforms showed significant increases or decreases in the rate at which users experienced content they deemed bad for the world, TikTok showed the greatest numerical improvement (-3.1%) followed closely by Reddit (-2.6%) and Facebook (-2.3%). Nextdoor was the only platform trending towards an increase (+3.5%) in the rate of users experiencing content that they deemed bad for the world.
The overall rankings mostly remained the same with some shuffling of platforms and services at the top of the list where LinkedIn fell from the top spot to #4, and Discord climbed to the top spot from #4. Pinterest (#2) and Facetime (#3) round out the top 4. X (Twitter; #16 of 16) and Facebook (#15 of 16) maintained their positions as having the two highest rates of experiences that are bad for the world.
Learning Something Useful or Important
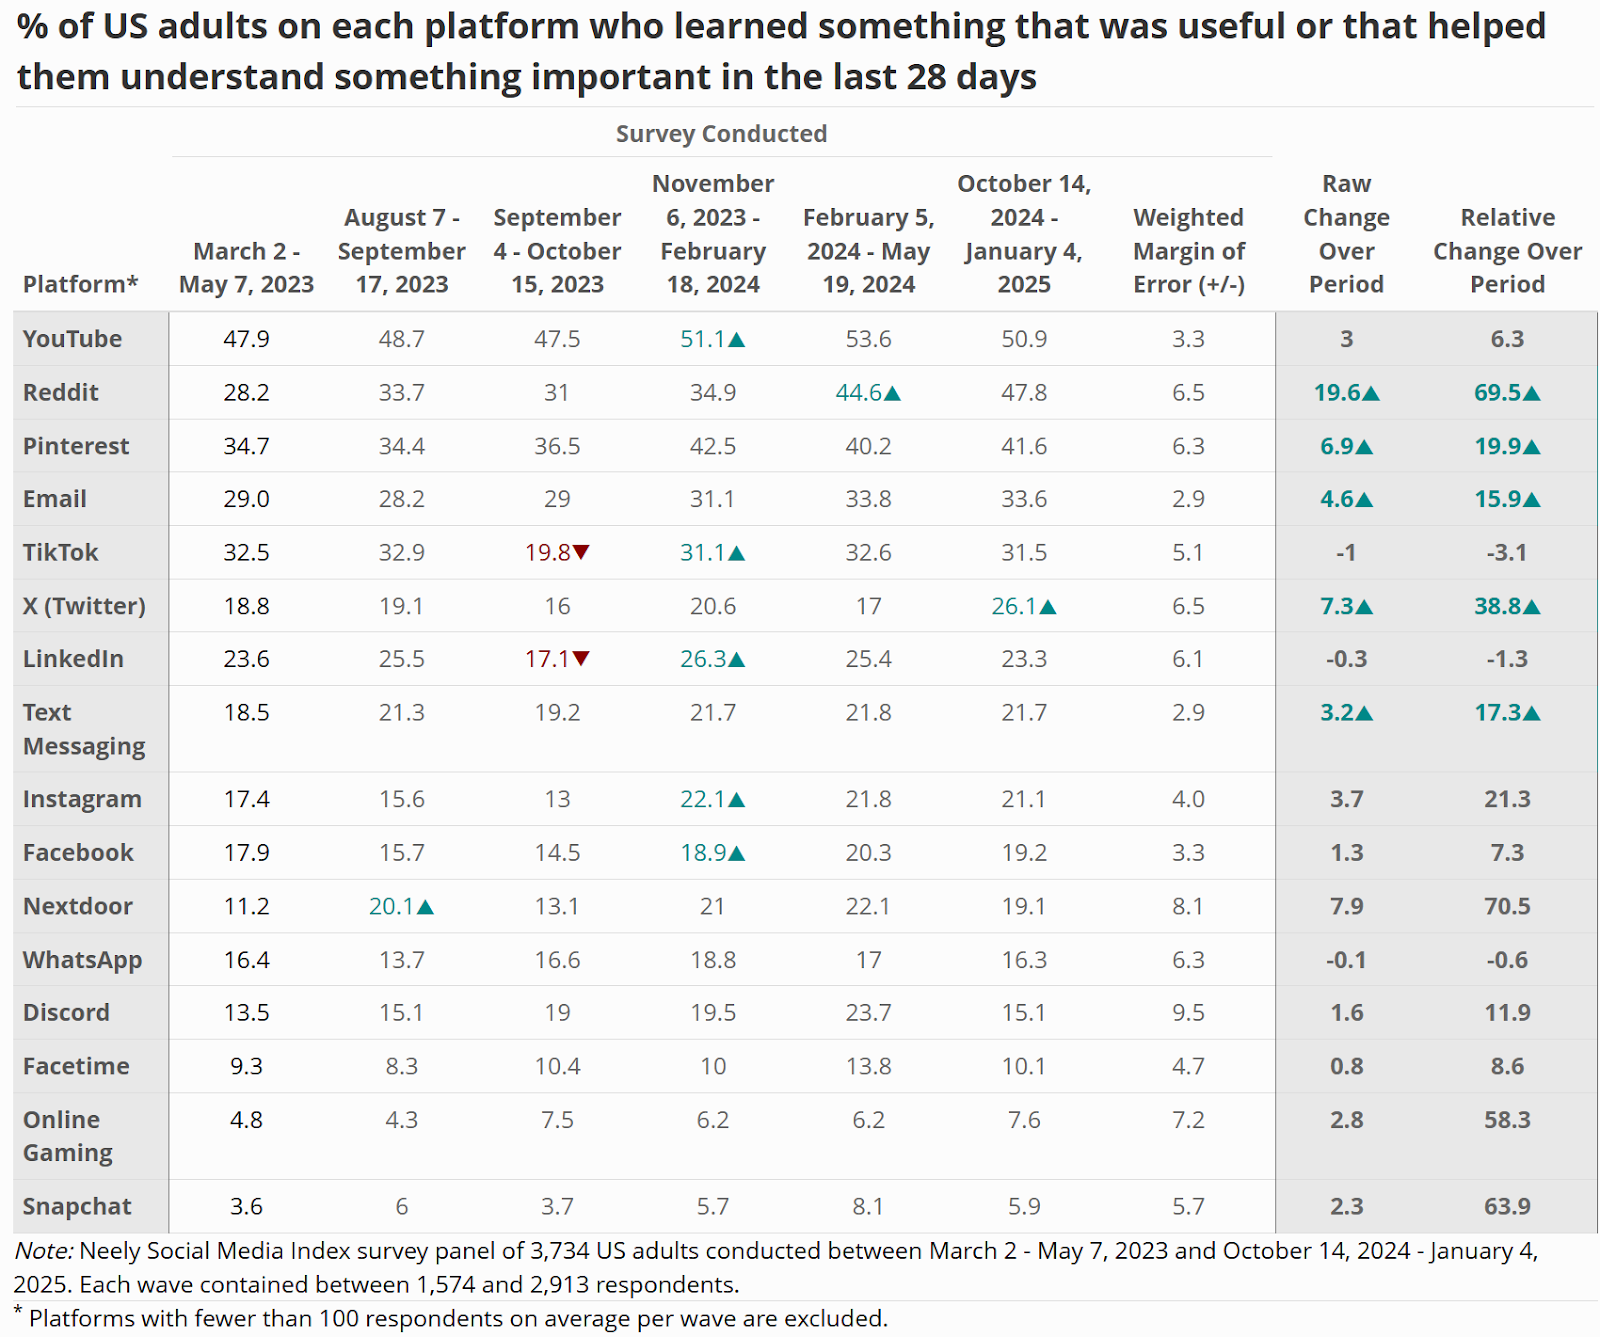
Next, we shift to looking at one of the two positive experiences users may experience on social media that are included in the Neely Social Media Index survey -- whether users learned something useful or important on these services and platforms in the previous 28 days. As seen in the table below, YouTube held onto the top spot with 50.9% of its users reported learning something that was useful or that helped them understand something important in the last 28 days. YouTube mostly held steady over the first 7 months of the longitudinal survey, but then showed a significant increase between November 2023 and February 2024, where it has held steady in the two most recent waves. In a statistical tie with YouTube is Reddit, which exhibited steady gains in each subsequent wave that amounted to a cumulative +19.6% increase in the past two years. Pinterest also showed small increases in each of the six waves of this survey which accumulated to a statistically significant +6.9% increase in the percentage of users saying they learned something useful or important on the platform relative to March 2023.
Email, X (Twitter), and Text Messaging users also reported an improvement in the rate of users reporting this positive experience on their platforms. Email and Text Messaging users were reporting small, steady increases in these rates at each time point, but X’s (Twitter’s) rate vacillated between increases and decreases in the different waves. The latest wave was conducted in the lead-up to and aftermath of the 2024 US Election, which may help explain why there was a 9.1% increase in its users reporting learning something useful or important on platforms like X (Twitter) where people are more likely to seek political content.
Nextdoor and Instagram both showed marginal increases in the rate of users reporting these informative experiences (+7.9% and +3.7%, respectively), but both increases were slightly smaller than their margins of error (+/- 8.1% and +/- 4.0%, respectively). All other platforms were well within their margins of error and did not show any significant change over the full time period.
Meaningful Connections with Others
Next, we look at the other of the two positive user experiences people may have on social media and communication services that we included in our survey -- whether or not they experienced a meaningful connection with others on the service within the past 28 days. As seen in the table below, the three services with the highest rates of their users reporting a meaningful connection with others -- WhatsApp, Facetime, and Text Messaging -- remained tied for the top spot, with the majority of users of each of those services reporting having these experiences in the most recent 28 days. On the other end of the spectrum, Nextdoor dropped to a tie with Pinterest, Reddit, X (Twitter), and YouTube for the lowest rate of users reporting meaningful connections with other people on those platforms.
There was a general numerical tendency for a higher percentage of users of most platforms to report experiencing a meaningful connection in the most recent survey waves. In our last report, we noted that the increase could have been due to the holidays potentially driving up the rate of meaningful connections across the board. This may still be the case, but it seems less likely because the rates of meaningful connections generally stayed at the elevated rates through May 2024 and did not show any significant regression between then and January 2025.
Over the course of the six survey waves, 5 of the 16 most widely-used platforms or services showed significant changes. WhatsApp’s 11.6% improvement marks the largest increase, but Facetime’s 6.7%, and Snapchat’s 6.2% improvements followed closely behind. Text Messaging and Instagram also showed significant increases in users reporting meaningful connections (both +4.5%), though the increases were somewhat smaller than the aforementioned platforms’ gains.
Nextdoor was the only platform showing a numerical decrease in users indicating they were making meaningful connections with others on the platform. Their 4.8% decrease was not statistically significantly different from zero, but was 533% more than the next biggest decrease (0.9% on Reddit).
No other platforms showed significant changes in users reporting meaningful connections with other people.

How do these platforms rank based on the rate of their users with each of these experiences?
Examining the percent change in experiences on platforms is instructive as it tells us whether user experiences within each of the platforms are improving or worsening over time. The downside of this approach is that it fails to display how these platforms stack up to each other accounting for their changes across these different dimensions. To address this, I created the following heat map that shows the ranking of each service across the four experiences we measured in our survey. To allow for easier comparison of each service’s current ranking to their ranking from one year ago, I included their previous rank in parentheses next to their current ranking. I also color-coded each tile so that better scores (i.e., more positive experiences and fewer negative experiences) are shaded in green and worse scores (i.e., fewer positive experiences and more negative experiences) are shaded in yellow.
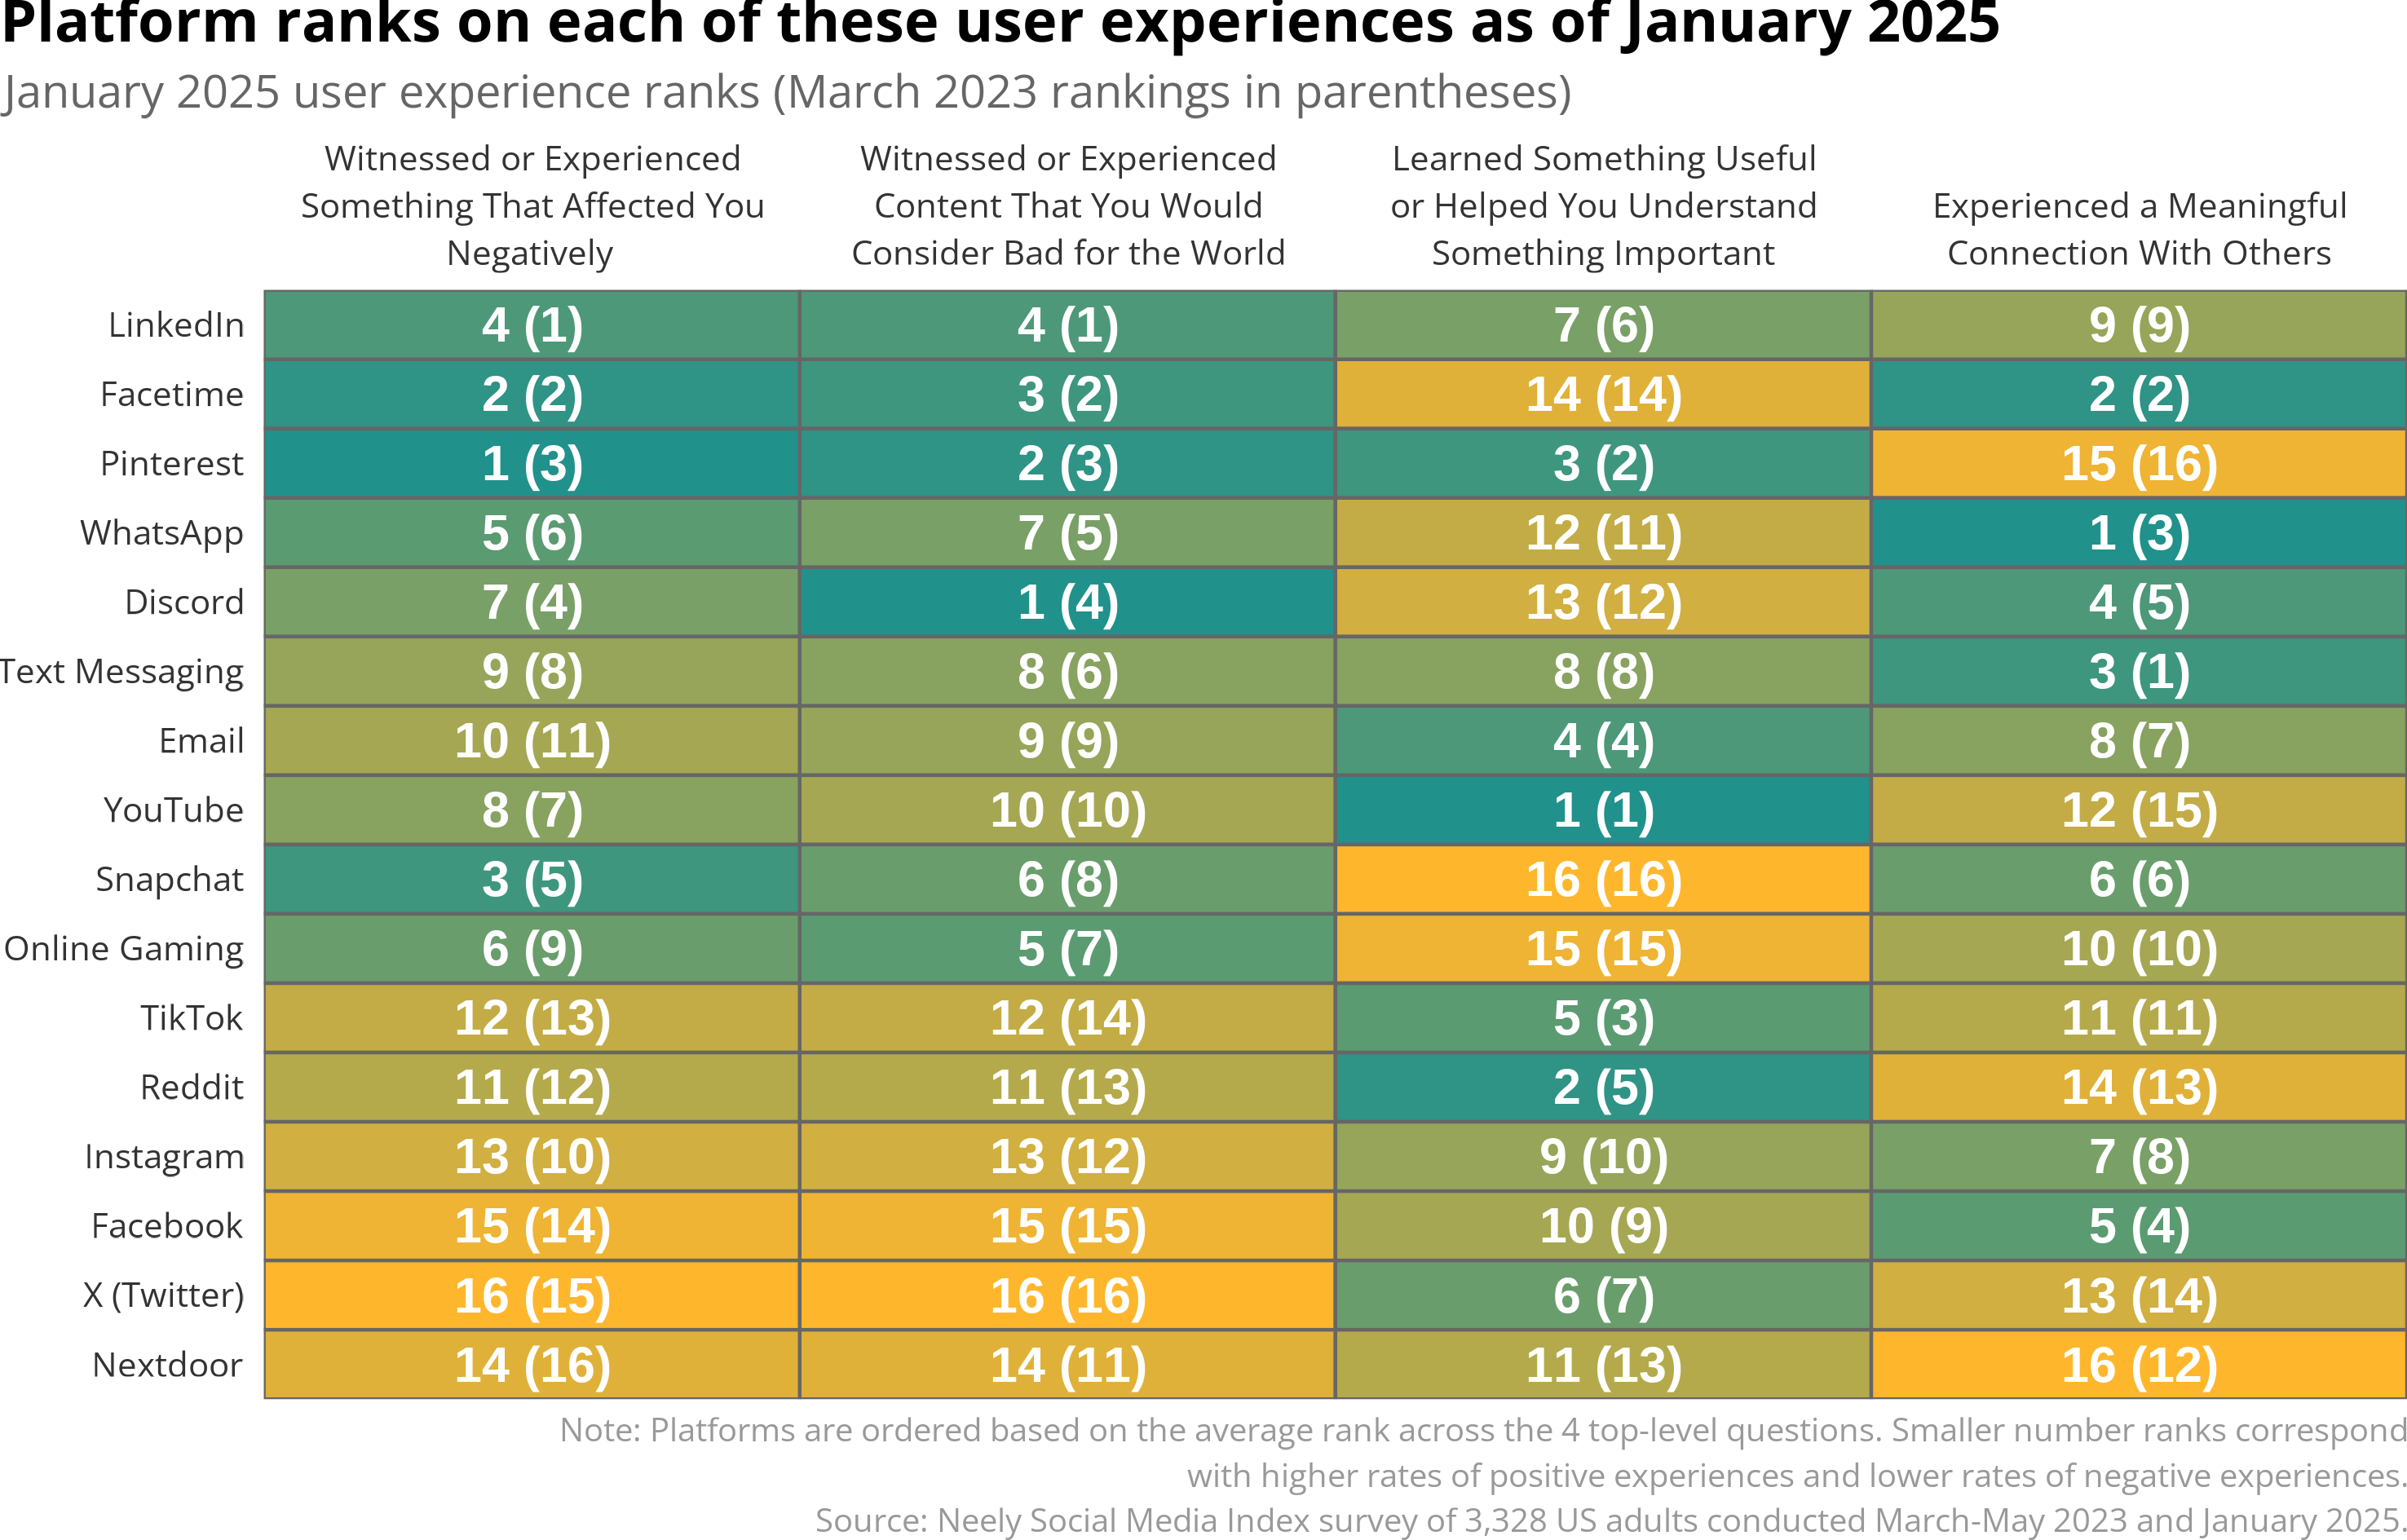
There are four main take-home points from these rankings:
Traditional social media platforms (e.g., X/Twitter, Facebook, Instagram, Reddit, TikTok) continue to tend to have more bad experiences than the more direct communication services (e.g., Facetime, text messaging) and the more focused / niche social media platforms (e.g., LinkedIn, Pinterest).
These services are relatively stable in their rankings over the first and last waves relative to each other. Even when one platform is improving in a user experience over time, they tend not to improve sufficiently to overtake the platforms above them in the rankings. The main exceptions to this are LinkedIn and Instagram, which both dropped several spots on both negative experience dimensions. Nextdoor and Reddit both leapfrogged several platforms in the learning something useful dimension and dropped 1 spot on having meaningful connections with others dimension, but diverged on the experiencing content that is bad for the world dimension. Specifically, in terms of bad for the world experiences, Nextdoor dropped 3 spots while Reddit improved by 2 spots.
Pinterest has overtaken the top spot for the fewest negative personal experiences, and held strong near the top of the list for the highest rates of learning experiences. Given that Pinterest does not prioritize user to user communication, it makes sense that they have the lowest rate of users reporting meaningful connections with each other on the platform. The only platform ranked higher than Pinterest for fewest negative societal experiences was Discord.
X (Twitter) has the highest rate of negative experiences, and has held that position in all of the 5 survey waves that we conducted since our baseline wave in March - May 2023.
Summary
The Neely Social Media Index survey is reflecting other publicly available data sources in showing that the percentage of US adults using some social media and communication services are decreasing, as is the case with X (Twitter) and YouTube, or increasing, as seems to be the case with Reddit. Other platforms, like Facebook and Snapchat, have also trended downwards in the percentage of US adults using them in each subsequent wave. These trends persisted across multiple waves, and while they generally were not significant decreases between individual survey waves, they did accumulate across the nearly 2 year period to amount to significant decreases on 7 of the 16 most popular platforms and services. 3 additional platforms are also exhibiting steady declines in their monthly active users, but those have not yet reached the statistical threshold for a significant decline.
In our first annual report examining changes in user experiences on social platforms and services over 12 months, we saw more significant improvements than significant regressions. In this second annual report, we again found more improvements than regressions. While we cannot isolate the specific cause(s) of these improvements, it is reasonable to presume that advertiser, legal, and regulatory pressure are part of the story. Specifically, numerous advertisers pulled their advertising campaigns from social platforms where ads were being displayed adjacent to child sexual abuse material or pro-Nazi content, 45 different US states sued Meta for not doing enough to protect children’s well-being, and regulatory bodies in the US, EU, and Australia are seeking large financial penalties for failures to comply with regulations, counter disinformation, and remove illegal content. Some of these improvements may also be due to these companies realizing that promoting better user experiences makes good business sense and tends to improve long-term growth, as internal research from Meta described in Jeff Horwitz’s Broken Code demonstrated and as our Senior Advisor and Integrity Institute fellow (me, Matt Motyl) argued in Tech Policy Press.
Since starting this project, we’ve presented our data and methods to numerous regulatory authorities, including the European Commission, the UK’s OfCom, Australia’s eSafety group, members of the United States Senate, and the United States’ Surgeon General. We’ve also had discussions with numerous companies about their results and how it maps to their product work. Finally, we have several academic projects ongoing that aim to publish formal longitudinal analyses of these data in academic journals. Momentum is growing for comparative user experience measurement. We are hopeful that more and more companies and jurisdictions will continue to track their longitudinal impact on users’ experiences and are glad to be part of this growing practice.
My man, you need to put this up somewhere in a PDF format and put it behind an email sign up
There are about 74 people that I can think of that I want to send this to
Well done
Matt this is super interesting -- do you have a breakdown of this data by age grouping? And were there any discernible differences in shifts in usage and experience -- good and bad -- by different age cohorts?